Politics of Parenthood State
Moms with young children in state legislatures

Representation level
of state legislators are moms of minor children
mom(s) of minors to reach proportional representation
mom(s) of minor children in the state legislature
total state legislators
| State | State Ranking | 2026 Total Moms of Minors | 2026 Total Legislators | 2026 % of Moms of Minors | Target % based on prop rep | # of Moms Needed for Proportional Representation |
|---|---|---|---|---|---|---|
| California | 1 | 26 | 120 | 21.67% | 18.5% | 0 |
| Virginia | 2 | 26 | 140 | 18.57% | 17.2% | 0 |
| Nevada | 3 | 11 | 63 | 17.46% | 17.3% | 0 |
| Minnesota | 4 | 29 | 201 | 14.43% | 16.1% | 4 |
| Vermont | 5 | 21 | 180 | 11.67% | 13.1% | 3 |
| Delaware | 6 | 9 | 62 | 14.52% | 16.5% | 2 |
| Arizona | 7 | 12 | 90 | 13.33% | 16.8% | 4 |
| Colorado | 8 | 12 | 100 | 12.00% | 15.8% | 4 |
| Illinois | 9 | 22 | 177 | 12.43% | 16.7% | 8 |
| Michigan | 10 | 17 | 148 | 11.49% | 15.8% | 7 |
| Oregon | 10 | 10 | 90 | 11.11% | 15.3% | 4 |
| Wisconsin | 12 | 14 | 132 | 10.61% | 14.8% | 6 |
| New Mexico | 13 | 13 | 112 | 11.61% | 16.7% | 6 |
| Washington | 14 | 16 | 147 | 10.88% | 16.5% | 9 |
| Hawaii | 15 | 9 | 76 | 11.84% | 18.3% | 5 |
| Idaho | 15 | 12 | 105 | 11.43% | 17.7% | 7 |
| Connecticut | 17 | 19 | 187 | 10.16% | 16.0% | 11 |
| Pennsylvania | 18 | 24 | 253 | 9.49% | 15.4% | 15 |
| Nebraska | 19 | 5 | 49 | 10.20% | 17.1% | 4 |
| South Dakota | 20 | 10 | 105 | 9.52% | 16.5% | 8 |
| Alaska | 21 | 6 | 60 | 10.00% | 17.4% | 5 |
| Ohio | 22 | 12 | 132 | 9.09% | 16.1% | 10 |
| Montana | 23 | 12 | 150 | 8.00% | 14.5% | 10 |
| Missouri | 24 | 17 | 197 | 8.63% | 16.3% | 19 |
| Rhode Island | 24 | 9 | 113 | 7.96% | 15.1% | 9 |
| Florida | 24 | 13 | 160 | 8.13% | 15.4% | 12 |
| New Jersey | 27 | 11 | 120 | 9.17% | 17.7% | 11 |
| Kentucky | 28 | 12 | 138 | 8.70% | 17.2% | 12 |
| New York | 29 | 17 | 213 | 7.98% | 16.0% | 18 |
| Maryland | 30 | 16 | 188 | 8.51% | 17.9% | 18 |
| North Carolina | 31 | 13 | 170 | 7.65% | 16.8% | 16 |
| Utah | 32 | 9 | 104 | 8.65% | 19.9% | 13 |
| Kansas | 33 | 12 | 165 | 7.27% | 17.1% | 17 |
| Iowa | 33 | 10 | 150 | 6.67% | 15.9% | 14 |
| Maine | 35 | 10 | 186 | 5.38% | 13.4% | 15 |
| Indiana | 36 | 10 | 150 | 6.67% | 17.1% | 16 |
| Massachusetts | 37 | 12 | 200 | 6.00% | 15.6% | 20 |
| Georgia | 38 | 16 | 236 | 6.78% | 18.7% | 29 |
| New Hampshire | 39 | 20 | 424 | 4.72% | 13.9% | 39 |
| Texas | 40 | 12 | 181 | 6.63% | 19.90% | 24 |
| Oklahoma | 41 | 8 | 149 | 5.37% | 17.8% | 19 |
| South Carolina | 42 | 8 | 170 | 4.71% | 16.7% | 21 |
| West Virginia | 43 | 5 | 134 | 3.73% | 15.1% | 16 |
| Louisiana | 44 | 6 | 144 | 4.17% | 17.9% | 20 |
| Arkansas | 45 | 5 | 135 | 3.70% | 17.6% | 19 |
| Mississippi | 46 | 6 | 174 | 3.45% | 18.6% | 27 |
| North Dakota | 47 | 4 | 141 | 2.84% | 15.5% | 18 |
| Wyoming | 48 | 2 | 93 | 2.15% | 15.8% | 13 |
| Tennessee | 49 | 3 | 132 | 2.27% | 17.0% | 20 |
| Alabama | 50 | 1 | 140 | 0.71% | 17.0% | 23 |
| TOTAL | 614 | 7386 | 8.31% | 16.8% | 630 |
Child age
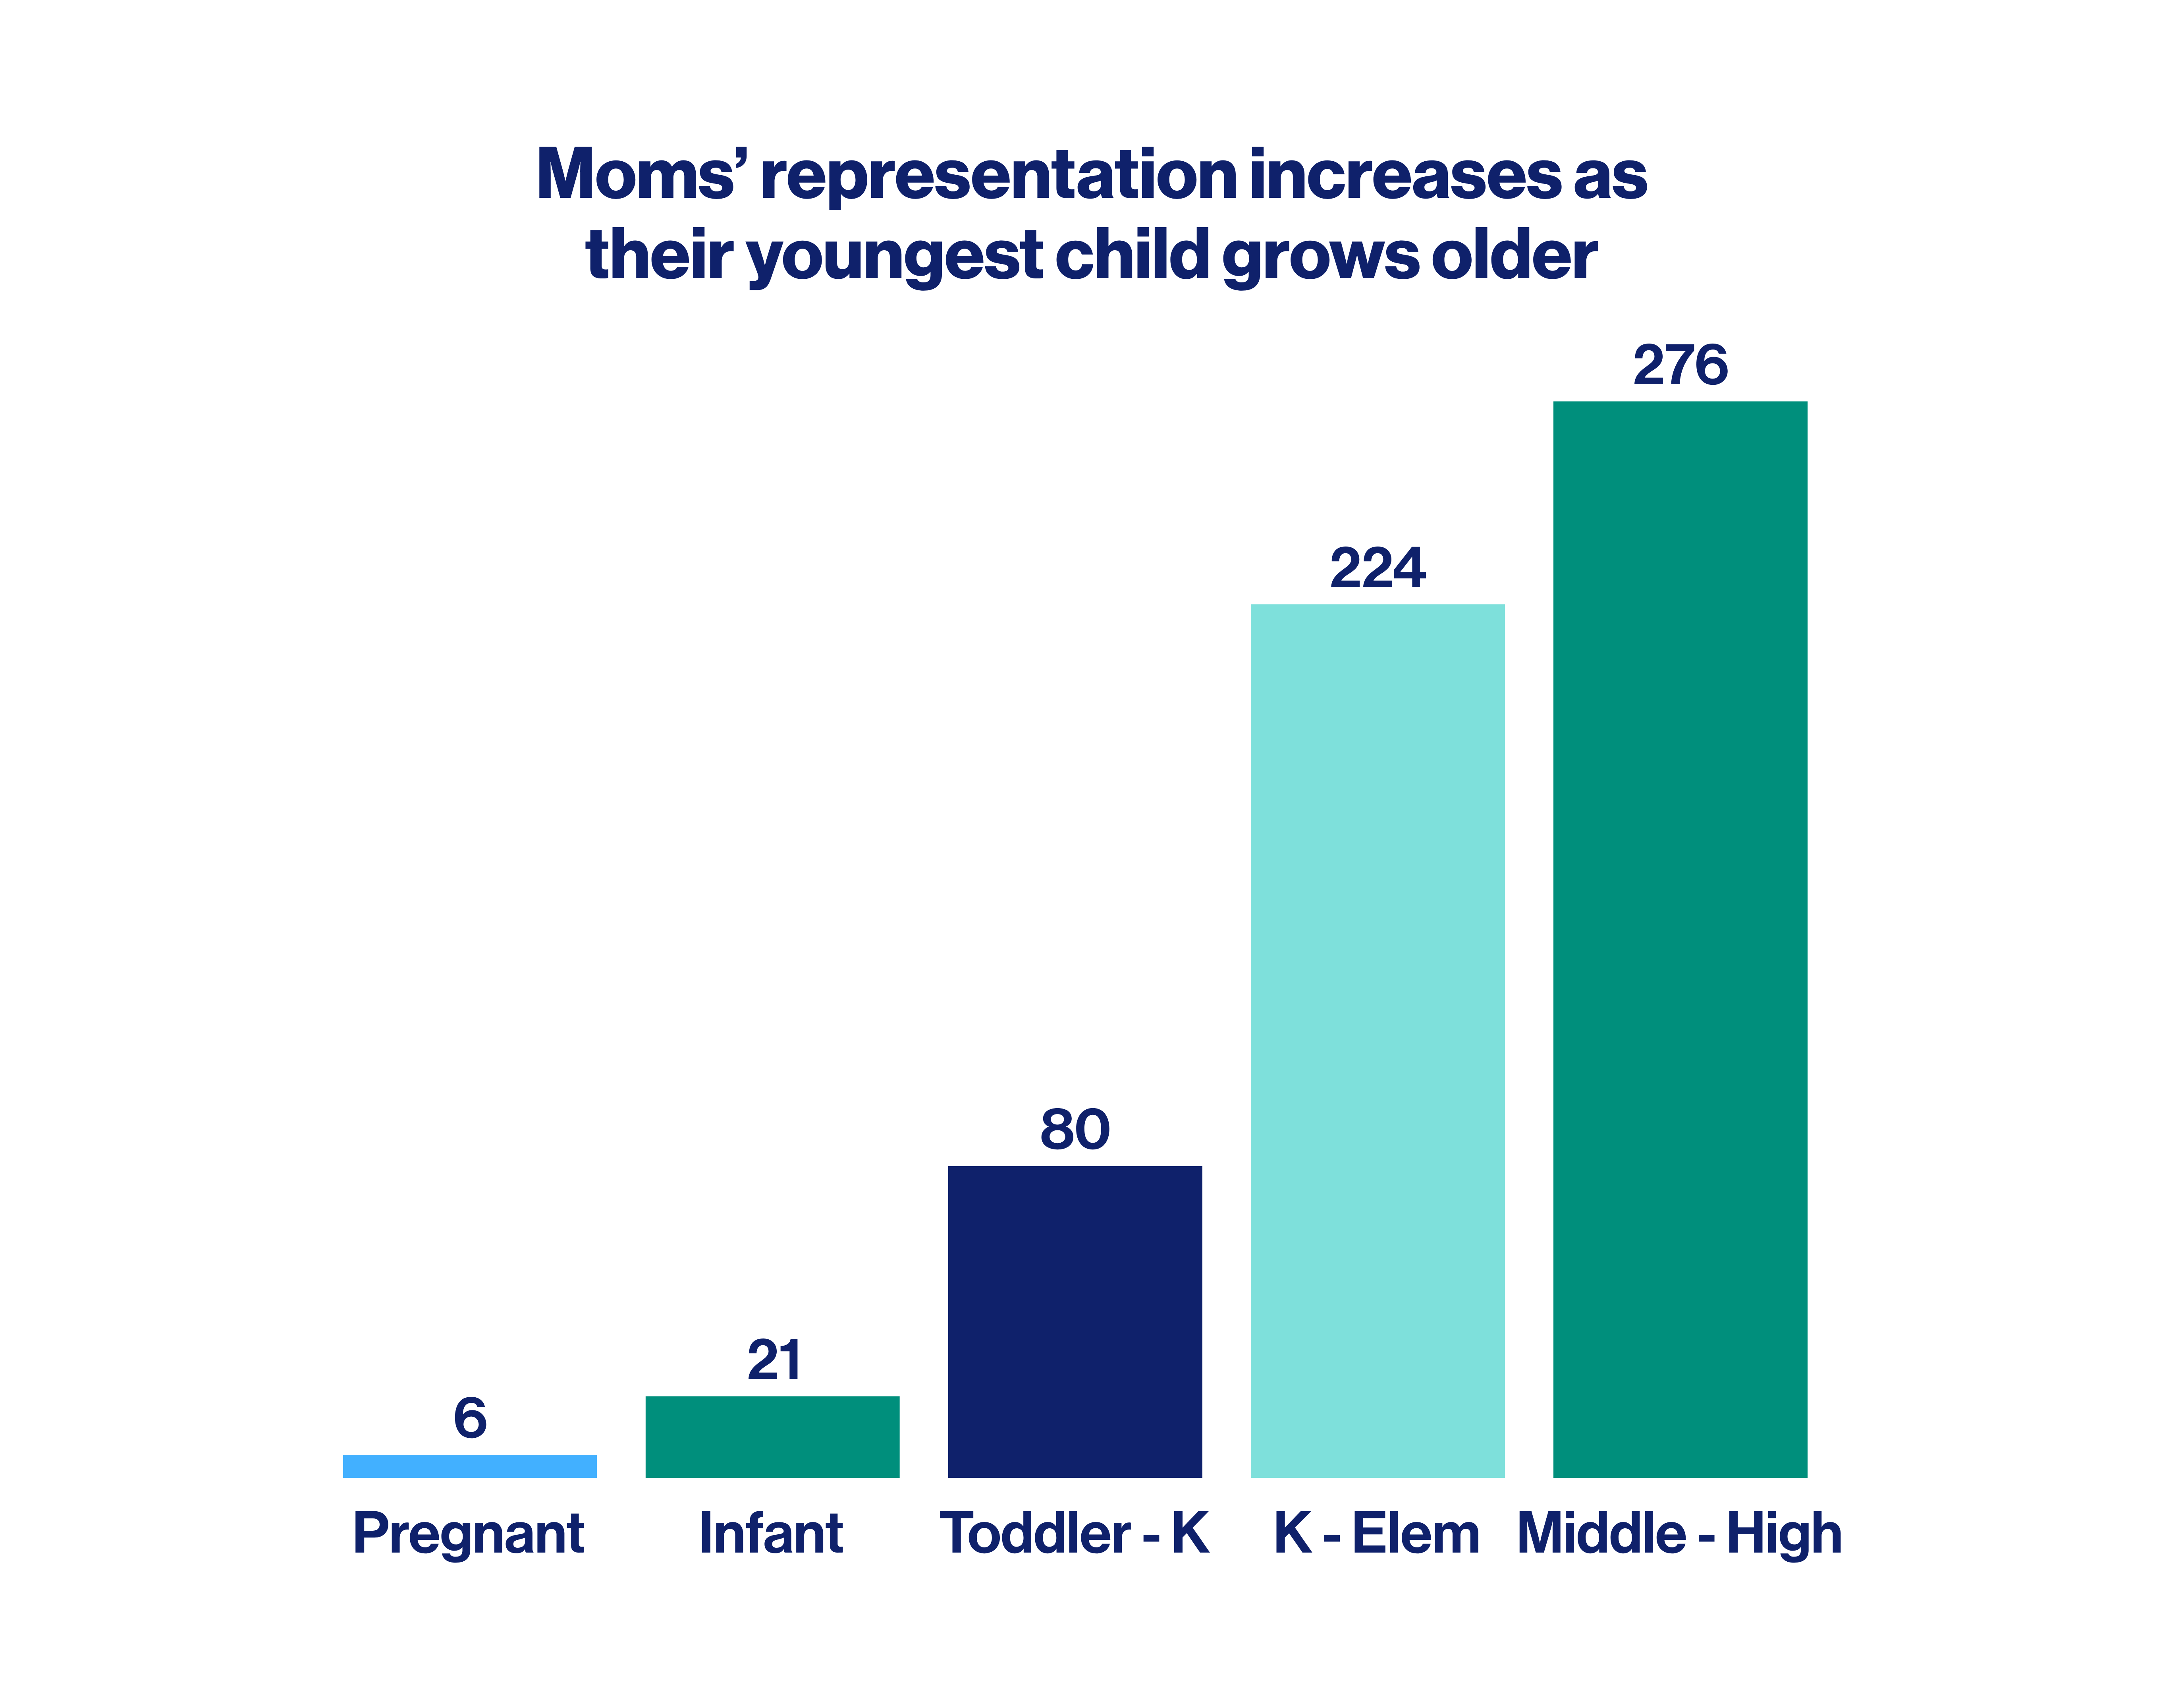
Our data shows that the age of legislators’ youngest child is negatively correlated with representation; in other words, the representation of moms of minor children starts to increase as their children get older. While moms of minors are underrepresented as a whole, moms of children under the age of six are even less represented in our state legislatures; of the 614 moms of minors in our dataset, only 107 are moms of children under the age of six. Moms of children under the age of six comprise only 1.4% of all state legislators in the U.S.
Race & ethnicity
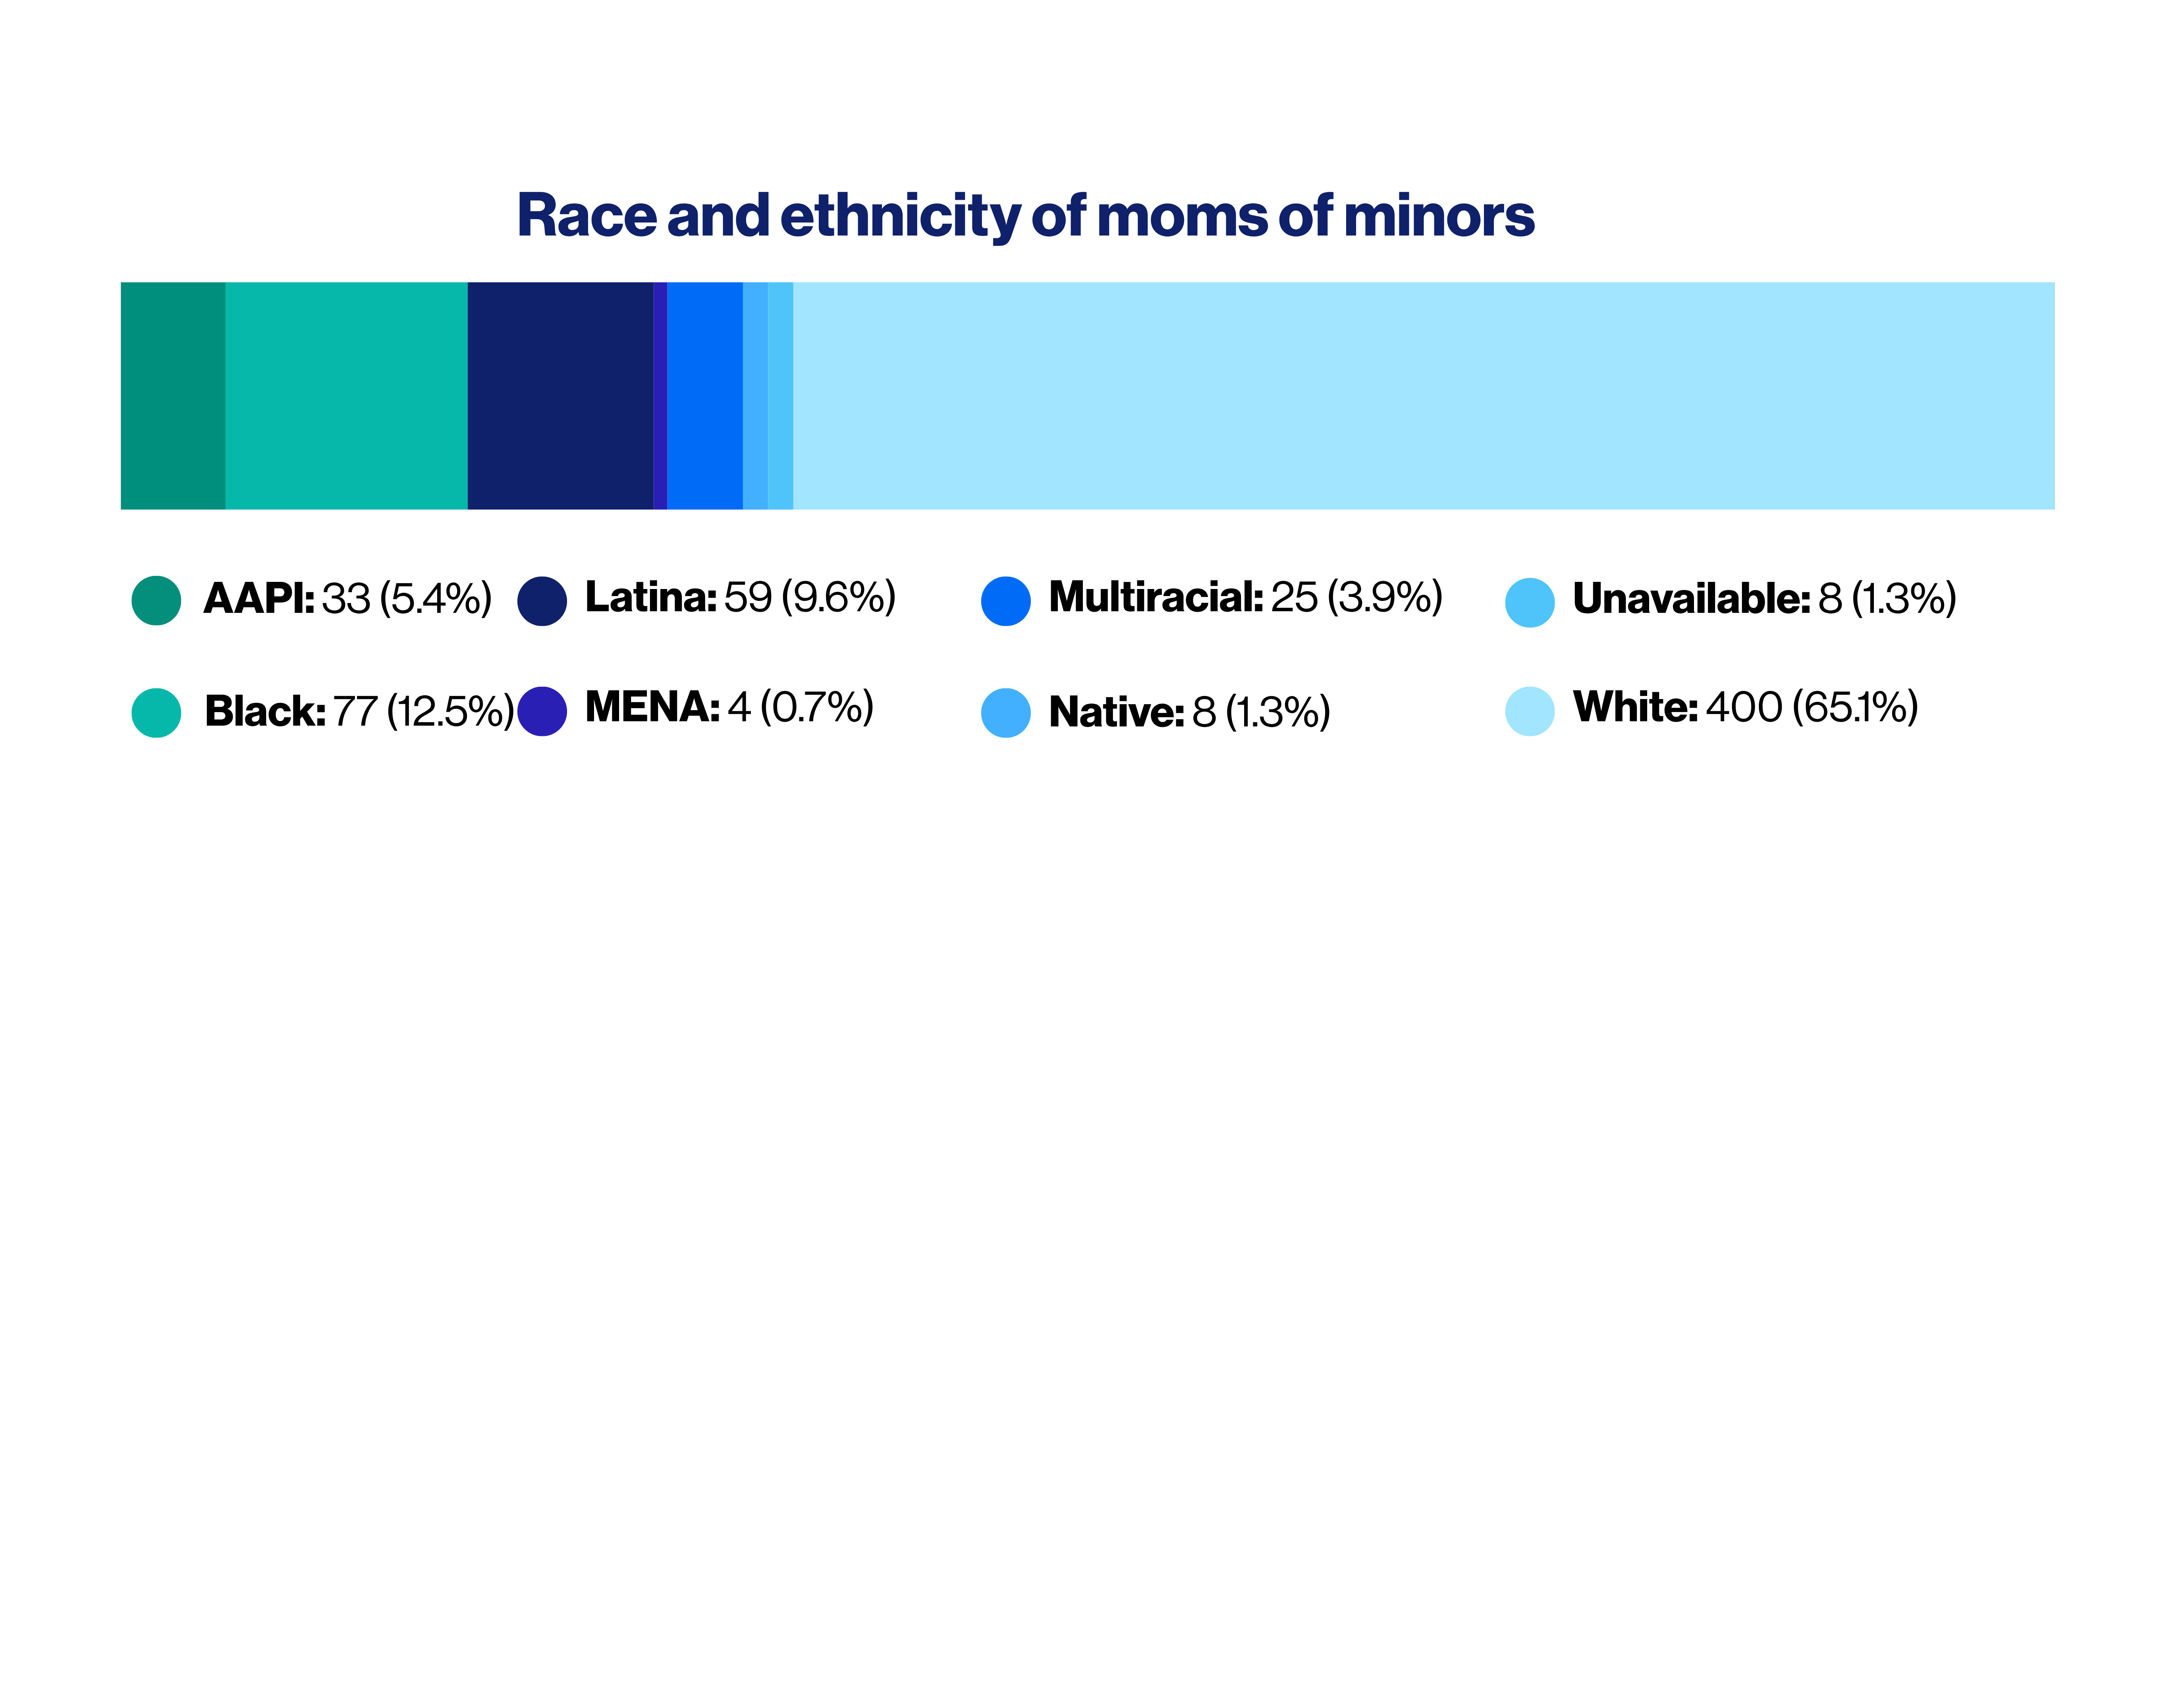
Only 2.8% of all state legislators are women of color with children under the age of 18.
Political landscape
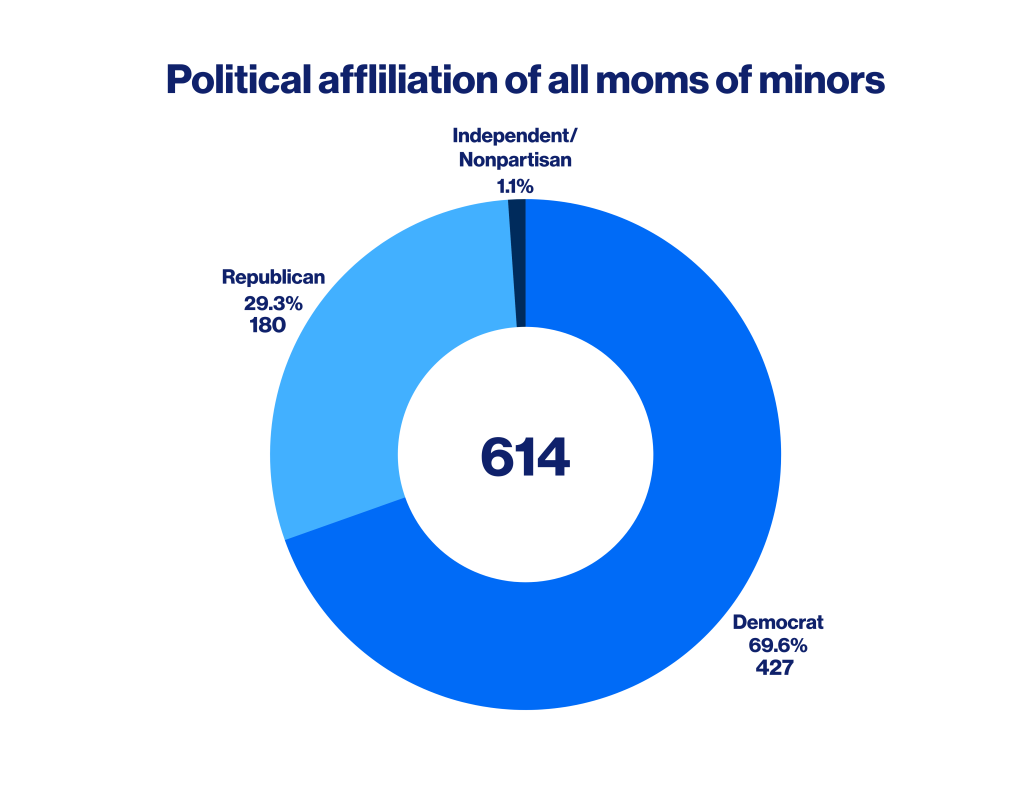
There is a distinct Democratic majority among moms of minor children, with 69.6% moms of minors identifying as Democrats and 29.3% identifying as Republicans.
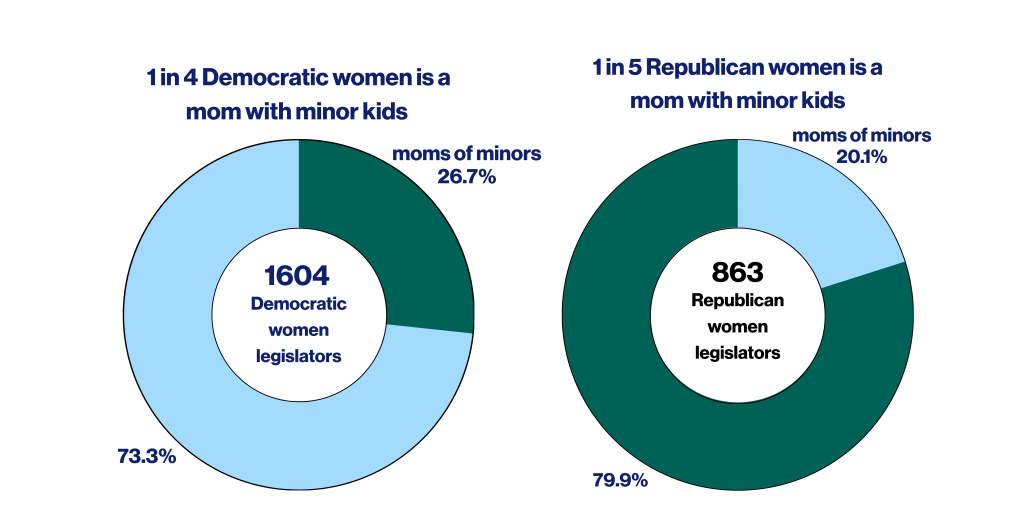
Among all women legislators in both parties, moms of minor children are underrepresented. For Democratic women, 1 in 4 are moms of minors. For Republican women, 1 in 5 are moms of minors.
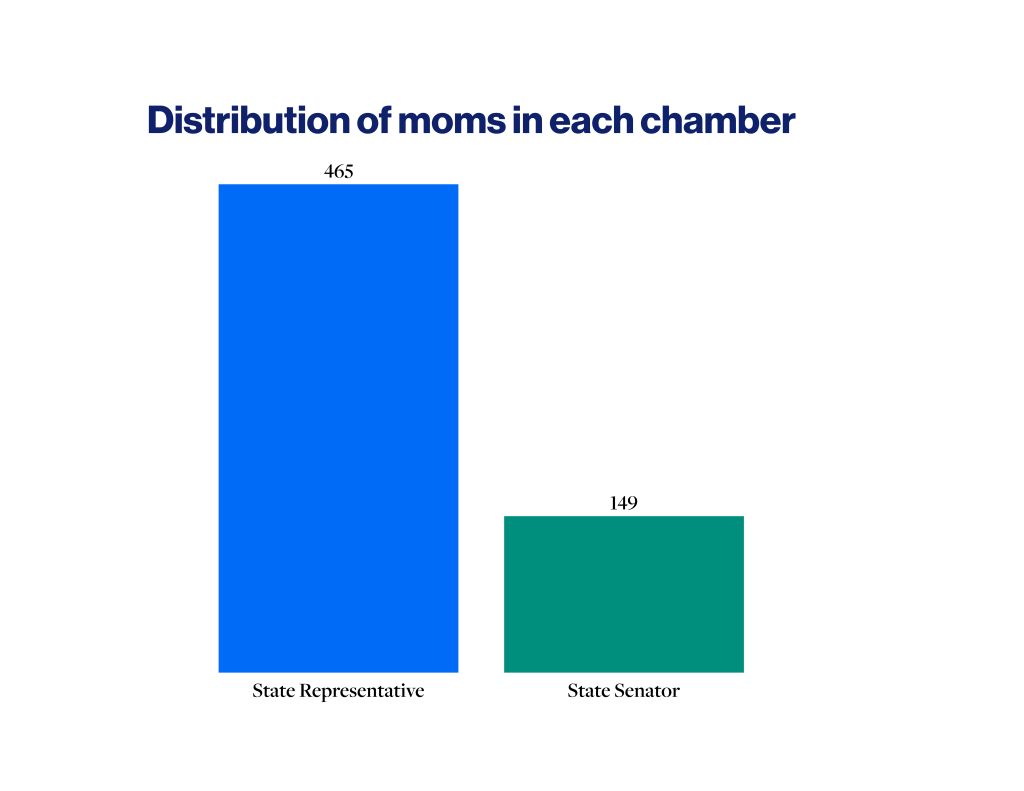
The majority of moms of minors across state legislatures are serving in state houses, with 75.7% in state houses and 24.3% in state senates.
Campaign Funds for Childcare
If parents can’t afford the childcare they need to campaign, it prevents parents from participating in the political system.

Campaign Funds for Security
Public servants shouldn’t have to choose between representing their communities and keeping themselves and their families safe.